Medias Handbook
Download the Medias Handbook in pdf format (Latest version)
(Version: April 2025)
Common protocol for the MEDiterranean International Acoustic Survey (MEDIAS)
The geographical areas that are covered by the MEDIAS surveys and the respective days at sea per survey are presented in the following Table 1 and Figure 1. References can be found on MEDIAS website: http://www.medias-project.eu. More detailed information on MEDIAS, from current and historical perspective, are given in editorial written by Giannoulaki et al., 2021 and review paper written by Leonori et al., 2021 (see: https://doi.org/10.12681/mms.29068 and https://doi.org/10.12681/mms.26001).
Table 1. The size of the geographical area that is covered by each Institute in the Mediterranean Sea (acoustic surveys) and in the Black Sea (pelagic trawl surveys). NM = nautical miles.
|
Country |
Institute |
Geographical area |
Size of area |
Standard number of days |
|
Greece |
HCMR |
Aegean Sea |
9000 NM2 |
40 |
|
Greece |
HCMR |
Eastern Ionian Sea |
2800 NM2 |
30 |
|
France |
IFREMER |
Gulf of Lion |
3300 NM2 |
33 |
|
Slovenia |
CNR-IRBIM/FRIS/IOR |
Adriatic Sea (Slovenia) |
117 NM2 |
1 |
|
Italy |
CNR-IRBIM |
Adriatic Sea (Italy) |
13200 NM2 |
48 |
|
Italy |
CNR-IAS |
Sicily Channel |
4300 NM2 |
16 |
|
Italy |
CNR-IAS |
Sardinia (east)* |
3207 NM2 |
** |
|
Italy |
CNR-IAS |
Tyrrhenian and Ligurian Sea |
6644 NM2 |
30 |
|
Spain |
IEO/CSIC |
Iberian coast |
8829 NM2 |
38 |
|
Malta |
MAFA |
Malta (east) |
1868 NM2 |
4 |
|
Croatia |
IOR |
Adriatic Sea (Croatia) |
13578 NM2 |
35 |
|
Bulgaria |
IO-BAS |
Black Sea |
3400 NM2 |
20 |
|
Romania |
NIMRD |
Black Sea |
4300 NM2 |
20 |
* Official inclusion of this survey in DFC is pending
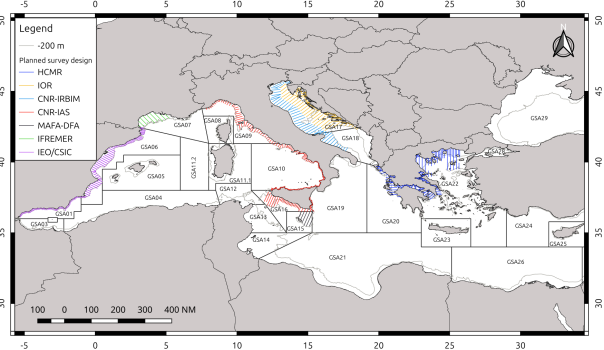 |
Figure 1. Surveys designs in the EU-MEDIAS.
Survey Identity
In the report of the DCF each Institute should report, the geographical area, the size of the area covered, the days at sea, as well as the period and dates in which the survey took place. In addition, the following vessel characteristics should be reported: Name of vessel, vessel length and vessel HP.
Echo sounder parameters
A variety of equipments with specific characteristics could be considered as adequate for the assessment of small pelagics. A split beam echo–sounder should be used for the echo–sampling. The angle beam, Athwart Beam Angle (in degrees), Along Beam Angle, and Ping rate of the echo–sounder should be reported. The frequency for assessment should be the 38 kHz, while the 18, 70, 120, 200 and 333 kHz can operate as complementary frequencies, depending on the research vessel used.
The pulse duration should be 1 ms; a pulse duration of 0.5 ms will be used only in case of Target Strength specific experiments. The threshold for assessment should be -70 to -60 dB depending on the survey and the ecosystem and should be reported. As the main objective is the optimum discrimination between fish and plankton, the background noise should be removed and in a next step, based on the available frequencies used in each survey, a frequency response-based mask should be developed to split the acoustic backscattering between fish and plankton. Whenever this cannot apply, the threshold for assessment should be set at -70 to -60 dB, depending a) on noise level (-60 dB in case of high noise); b) the peculiarities of each area regarding school morphology and plankton density (-60 when plankton is dense, but -70 dB when small schools dominate the area); c) echo-sounder features; d) time of day that echo acquisition is carried out.
The ping rate should be set as fast as possible depending on depth, in order to assure good echo discrimination. At least one calibration of echo-sounder should be held per survey based on the procedure described in the manual of each echo-sounder and according to the principles described by Demer et al. (2015). The calibration parameters and the results of the acoustic equipment should be reported by survey according to the following Table 2. In principle, one calibration per survey is suggested.
Table 2. Calibration report
|
Calibration report |
|
|
Frequency (kHz) |
|
|
Echo-sounder type |
|
|
Transducer serial no. |
|
|
Vessel |
|
|
Date |
|
|
Place |
|
|
Latitude |
|
|
Longitude |
|
|
Bottom depth (m) |
|
|
Temperature (oC) at sphere depth |
|
|
Salinity (psu) at sphere depth |
|
|
Speed of sound (ms-1) |
|
|
TS of sphere (dB) |
|
|
Pulse duration (s) |
|
|
Equivalent 2-way beam angle (dB) |
|
|
Default TS transducer gain |
|
|
Iteration no. |
|
|
Time |
|
|
Range to sphere (m) |
|
|
Ping rate |
|
|
Calibrated TS transducer gain |
|
|
Time (GMT) |
|
|
RMS |
|
|
sA correction |
|
Survey timing
June-July is the best period for MEDIAS survey for biological reasons, however, in the impossibility of defining a common period for all MEDIAS surveys, due to research vessel availability problems, a specific official period has been established for each GSA, taking into account pragmatic, historical and operational considerations (table 3). This will ensure the continuity of time series within the GSA level and keep the sampling period consistent among years. A buffer period of plus or minus one month is authorized in case of particular difficulties that may be encountered in certain years, while considering the month of October as an upper limit not to be exceeded. However, if the survey has to be brought forward or delayed by more than this buffer month outside the official period, a request must first be made to MEDIAS SC and the EC before launching the survey.
Table 3. Official period for MEDIAS surveys per GSA
|
GSA |
Official period |
|
GSA1 |
6 7 |
|
GSA6 |
6 7 |
|
GSA7 |
6 7 |
|
GSA9 |
8 9 |
|
GSA10 |
7 8 |
|
GSA15 |
7 8 |
|
GSA16 |
7 8 |
|
GSA17 E |
6 7 |
|
GSA 17 W |
6 7 |
|
GSA 18 |
6 7 |
|
GSA 20 |
9 10 |
|
GSA 22 |
6 7 |
|
GSA 29 (summer) |
6 7 |
|
GSA 29 (autumn) |
10 11 |
Survey Design
The survey design for the acoustic sampling should consider the characteristics of the spatial structures of small pelagic fish in each area as well as the peculiarities in the topography of each area. Transects should be run along the greatest gradients in fish density, which is often related to gradients in bottom topography, meaning that transects will normally run perpendicular to the coastline/bathymetry. Inter-transect distance should be adjusted to achieve the minimization of the coefficient of variation of the acoustic estimates for the target species in each area but also take into account survey duration. In cases that topography is complex like in the case of semi-closed gulfs transect design could be decided otherwise. The survey design in each area should be reported. Based on some preliminary studies of the spatial structure characteristics of small pelagics in the Mediterranean Sea (WKACUGEO 2010; MEDIAS 2011) the inter-transect distance should not exceed 12 NM.
Specifically, within certain common workshops that were held in the framework of the AcousMed project (Anonymous, 2012) and past MEDIAS meetings, the existing survey design at different areas has been reviewed along with area peculiarities (e.g. size of the area, topography, survey duration). In the framework of these workshops, geostatistical analysis was applied on historical acoustic data under a common protocol and different survey designs were evaluated towards optimization, considering the spatial characteristics of small pelagic fish aggregations. The optimum inter-transect distance in each area has been identified and proposed. The results have been adopted at the 5th MEDIAS coordination meeting. However, in order to evaluate the survey performances in each area, a dedicated session with this specific Terms of Reference should be held when needed within the framework of the MEDIAS annual meetings.
Vessel speed during acoustic sampling should be adjusted depending on vessel noise as set by the ICES-WGFAST (WGFAST 2006). The working group agreed that vessel speed of 8-10 knots is adequate for a split beam echo sounder of 38 kHz. At higher speeds, problems might be encountered with engine noise or propeller cavitation.
It was strongly recommended that if species identification depends on the recognition of schools based on the echograms, the survey will have to take place only during day- time, being interrupted during periods in the 24-hour cycle when the schools disperse.
Otherwise, if available survey time does not permit this, echo sampling might be extended. In this case, echo allocation into species will not be based on school shape identification and justification should be given in the report that this does not affect the accuracy of the estimations. In the framework of the AcousMed project appropriate acoustic data from daytime and nighttime have been analyzed in order to determine the degree of error. Results from recent study (Bonanno et al, 2021) indicated that night estimates can be higher or lower compared to daytime estimates largely depending on the area peculiarities and especially the local plankton and fish densities. However, results showed that correction is possible, and it is advisable when night sampling is inevitable.
Transects should be extended as close to the coast as possible in order to cover adequately the spatial distribution of sardine. The minimum distance from the shore largely depends on the size of the research vessel used. In any case, the Distance of acoustic sampling from the coast in respect to the Bottom depth should whenever this is possible reach the 10 m isobath. In each case the minimum bottom depth of each survey should be reported. The maximum echo-sounding depth should be 200 m, and the minimum echo-sounding depth should be reported as it depends on the draught of the research vessel.
The Elementary Distance Sampling Unit (EDSU) for echo integration should be 1 nautical mile (NM), excluding “bad data”. In the case of parallel transect designs, the acoustic energy in the inter-transect tracks will not be considered for assessment purposes. The working group concluded that the target species of the survey will be anchovy (Engraulis encrasicolus) and sardine (Sardina pilchardus).
The echo partitioning into species should be based on echogram visual scrutinization. This will be done either by direct allocation based on the identification of individual schools and/or allocation on account of representative fishing stations.
Target Strength (TS) equations: in the Mediterranean Sea, different species TS equations are currently applied depending on the area. The application of common TS equations should ideally derive from in situ estimations of TS, preferably based on acoustic data from the Mediterranean Sea. For this purpose, specific workshops were held in the framework of AcousMed project as well as DCF and MEDIAS coordination meetings but largely based on the analysis of available historical data. Based on these results, the 5th MEDIAS coordination meeting agreed to apply for sardine the following TS-TL equation this point forward:
TS=20log (TL)-72.6 dB
where TS=Target Strength, TL=Total Length. The Steering Committee at its 14th annual meeting also agreed that in addition to use previous TS equation for sardine (with b20= -72.6 dB), IFREMER also will continue to use a b20=-71.2 dB in the Gulf of Lions, for compatibility reasons to the long time-series available, but in line with harmonization IFREMER will also provide estimates based on common TS that will be used for regional mapping purposes. Analysis results concerning anchovy indicated large differences between areas. For this purpose, MEDIAS partners concluded that further analysis using more data from all areas is needed and agreed not to propose a single TS equation and b20 value for anchovy. It was suggested that the work regarding anchovy TS should continue within the framework of specific MEDIAS workshops, using available data from additional areas, such as Croatia. Thus, it was agreed that for the time being, the historical Target Strength equations for anchovy will be maintained in each area and the applied TS equation should be reported.
Acoustic data processing for the assessment of the target species, Echoview or alternative Movies 3D software should be used for acoustic data analysis and the estimation of abundance. For compatibility reasons, raw data should be available into a common *.hac file format. Due to the large file size raw data will be stored within the responsibility of each Institute. The common *hac format will be also available for the requirements of the Data Collection Framework (DCF) upon request.
A script in R to calculate geostatistical CV associated with biomass estimates from acoustic survey, based on Walline et al. (2007), has been created by Marco Barra (CNR) and tested by all MEDIAS groups. This procedure is considered mandatory to calculate geostatistical CV to be provided along with acoustic estimates.
Workflow for acoustic data processing
During the 6th MEDIAS meeting the Steering Committee agreed on a common workflow for acoustic data processing, which is structured in the following four steps:
a) Load and view data
b) The acoustic data acquired by echo-sounder during the survey are loaded in a software environment for visual exploration in terms of echograms and maps.
c) Calibrate
d) The results of calibration procedure, carried out on board the vessel, are installed in order to convert the raw acoustic data into absolute backscattering measurements. Such step includes also the installation of correct settings of transducers position referred to GPS antenna.
e) Remove background noise
f) Before analyzing the acoustic data any ambient noise present in the underwater environment has to be removed.
g) Detect and filter
The step includes the use of grids, lines, regions and mathematical operators for excluding from the collected acoustic data any backscattering signal not linked to the presence of fish and/or plankton.
Specific aspects are:
1. Intermittent noise removal;
2. Evaluate possible interferences that may produce artefacts in the echograms, and adopt a procedure for removing them;
3. Surface and seafloor exclusions;
4. Use lines for correctly separating the backscattering signals from surface and bottom;
5. Single targets estimation;
6. In case of organisms scattered in the water column, typical of night-time data acquisition, adopt the necessary procedure for separating fishes from planktonic organisms;
7. Schools estimation;
8. Use regions and/or mathematical operators for estimating backscattering signal due to fish aggregations.
Abundance indices
The following abundance indices should be estimated and reported in the DCF within the framework of MEDIAS:
The Total fish NASC per EDSU, as well as Point maps of total fish NASC should be available.
The target species of MEDIAS for assessment purposes will be anchovy (Engraulis encrasicolus) and sardine (Sardina pilchardus). The abundance indices estimated by all MEDIAS parties provided in the DCF report should include both NASC and Biomass estimations, for the whole area. Specifically, for the two target species abundance estimates provided in the report are: NASC/EDSU; Biomass/EDSU; Number of fish/EDSU; Number/age and per length class; Biomass/age and per length class. Point maps of anchovy and sardine in NASC/mile; Biomass/mile should also be available. In addition, abundance indices could be given for all pelagic species in the community which are important in each area.
The catch compositions of the hauls: pie-charts indicating percentage by weight per species and/or group of species should be available also.
Fish sampling
According to the standard methodology followed in acoustics, species allocation of the acoustic records is impossible if trawl information is not available. Fish sampling is required to collect representative samples of the fish population in order to identify echoes. The main objectives of trawling in an acoustic survey are a) to obtain a sample from the school or the layer that appears as an echo trace on the sounder for echo trace identification and allocation into species and b) to get biological information and evaluation of the size distribution of each species. Therefore, the trawling gear used is of no importance as long as it is suitable to catch a representative sample of the target-school or layer. In the framework of the AcousMed project available past data from different areas in the Mediterranean were analyzed based on a common protocol. Results showed no significant differences between day and night sampling (Machias et al., 2013). The coordination meeting based on these results concluded that samples collected during both day and night in the same survey could be merged and used for the necessary estimations.
In addition, the sampling intensity of the hauls cannot be pre-determined because of the objectives of the acoustic survey per se. The sampling intensity in an acoustic survey depends on the size of the area covered, the frequency of occurrence of different echo traces on the sounder screen and the spatial characteristics of fish aggregations. In addition, the geographical coordinates or the sampling depth of the hauls cannot be pre-determined because pelagic species execute extended horizontal and vertical movements. Schools morphometry and energetic characteristics might change depending on the area, the time interval or even the fishing pressure. Therefore, the sampling strategy has to be adaptive depending on the school characteristics per area, time period and year.
Considering that, within a common protocol, the different research vessels used and the peculiarities of each area the following points have been agreed:
· A pelagic trawl will be used in all areas for biological sampling.
· Maximum codend mesh size should be equal to 24 mm (side of mesh equal to 12 mm). The codend and the trawl characteristics used in each area will be reported. If codend cover is used it should be reported and not to be used for LFD of target species.
· The vertical opening of the pelagic hauls along with the netsounder used should be reported.
· The duration of hauls should be no less than 30 min for unknown echoes and when multi-species scattered echoes are being fished.
· Vessel speed during fishing should be 3.5–4.5 knots.
· It is widely accepted that in the framework of an acoustic survey a standard total number of hauls cannot be set because this depends on the fish distribution and abundance found in each survey. However, in any case the hauls number must be adequate in order to a) ensure identification of echo traces; b) obtain a representative length structure of the population for each target species; c) obtain species composition and biological samples.
· Target species of the MEDIAS surveys are anchovy and sardine, but biological data for all species in the pelagic community (e.g. bogue, horse mackerels, sprat, etc.) regarding length frequency distribution and Length-Weight relationships should also be acquired.
Biological and oceanographic parameters
The following biological parameters should be estimated in each survey:
· The Length frequency distribution (0.5 cm) should be estimated from a representative sample for each fish species per haul. Total length will be measured for all species. The Length–Weight relationship for all pelagic species will be estimated and reported. The size of each sample should be set at minimum the one described in the respective protocol of the Data Collection Framework (DCF).
· For the target species, anchovy and sardine, the mean Total Length at age should be estimated, as well as the Age-Length-Key used for the conversion of abundance indices to abundance-at-age. Data should be provided according to the DCF instructions.
· Otolith reading criteria for anchovy and sardine should be in accordance with ICES WKARA2 report (2017) and follow the recommendation of that meeting. In particular the 1st of January should be considered the birthdate for anchovy from an assessment point of view in relation to time-steps in the assessment. Mean TL at age should be reported.
· It is strongly recommended the use of ICES WKSPMAT report (2008) scale during the lab processing for classifying the reproductive phase for anchovy and sardine, particularly for identifying mature/immature which are very relevant to stock assessment purposes, in order to obtain the L50 estimation. This scale allows reaching a higher accuracy since it has been developed specifically for small pelagics (indeterminate spawners).
· Since the environmental parameters are very important for small pelagic fish, a minimum of 3 CTD stations should be held per transect or a grid of stations with density adequate to describe the oceanography of the surveyed area. Temperature and salinity are the hydrographic parameters that should be measured in the entire water column at each station.
· Furthermore, the need for a common database has been concluded. The need for collaboration with the respective surveys in the Atlantic region (e.g. Bay of Biscay) has also been discussed and agreed. In the framework of this collaboration, information and experience will be exchanged.
Database
In the framework of the RDBFIS I & II projects as well as a MEDIAS workshop, a common database design has been decided for all MEDIAS surveys. The 18th MEDIAS coordination meeting agreed to use this database framework to store acoustic and biological data collected within the acoustic surveys in the Mediterranean Sea. The MEDIAS database is comprised of 3 modules: Acoustics (6 tables), Pelagic Trawl (4 tables) and CTD (3 tables); the corresponding tables in the relevant schemas were all inspected and adapted (wherever needed) by the group, field by field. Pelagic trawl surveys carried out under DCF in Bulgarian and Romanian Black Sea waters were also included. The database can be accessed via the following link: https://medbs-rdbfis.hcmr.gr/. The detailed table structure and validation rules are available in Annex V.
![]()
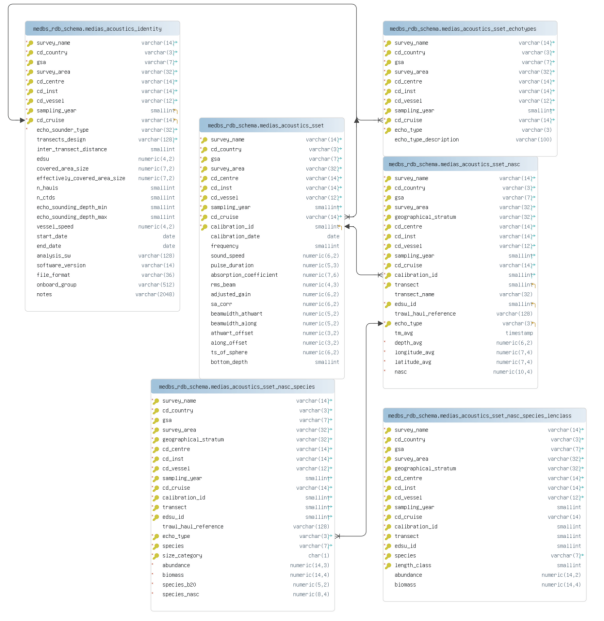
Figure 2. Database schema diagram for MEDIAS acoustic tables.
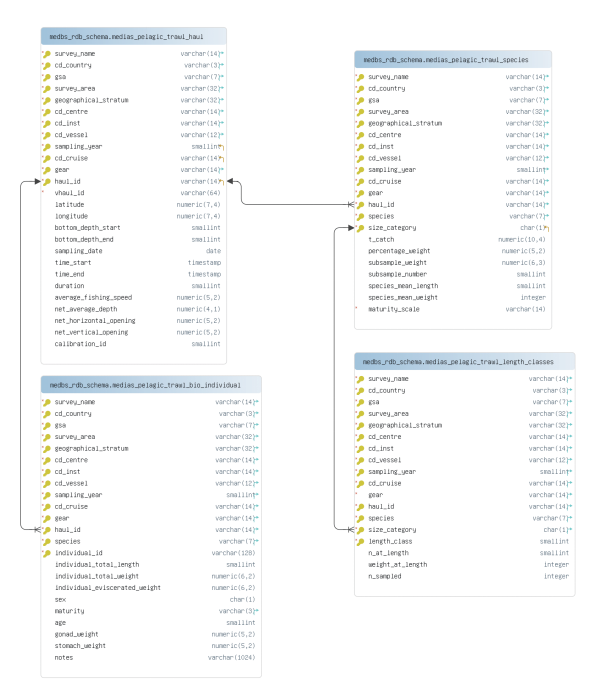
Figure 3. Database schema diagram for MEDIAS pelagic trawl tables.
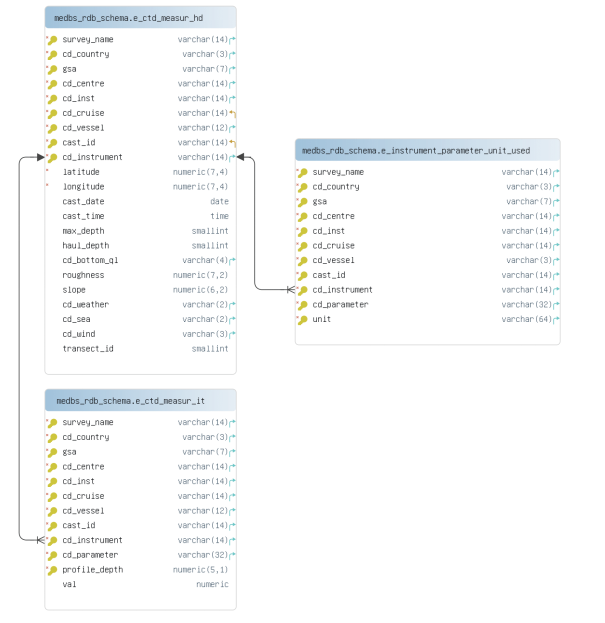
Figure 4. Database schema diagram for MEDIAS CTD sampling tables.
Ecosystem indices related to acoustic surveys
The abilities of currently applied MEDIAS surveys to contribute towards an ecosystem-based management approach in relation to the current and the future DCF requirements was extensively discussed by the MEDIAS partners. In the following Table 4 the ecosystem indices that can derive from acoustic surveys (based on data regularly collected and analyzed) are reported.
Table 4. Ecosystem indices that could be derived from acoustic surveys.
|
Good Environmental Status indices |
Spatial/temporal strata |
Spatial strata |
GSA |
||||
|
Acoustic survey |
|||||||
|
Time periods |
Season (Summer/Autumn depending on the area) |
||||||
|
Taxonomic levels |
Community |
Pelagic fish (Species composition, occurrence in pelagic hauls) |
|||||
|
Target Species |
Adult |
Anchovy |
|||||
|
Sardine (for Mediterranean) |
|||||||
|
Sprat (for Black Sea) |
|||||||
|
Indices |
Biodiversity |
Species |
Population size |
Acoustic estimates |
Total biomass & abundance estimates for target species |
||
|
Estimation error (CV) (i.e. as agreed based on a common estimation procedure, see ToRs) |
|||||||
|
Population condition |
Biomass & |
Anchovy, Sardine, Sprat (Black Sea) |
|||||
|
Recruitment index |
Sardine (i.e. Number at Age 0 of the population based on summer surveys) |
||||||
|
Habitats |
Habitat condition |
Hydrological condition |
Temperature (i.e. SST: average at 10m, estimated as the interpolated mean value for the whole area) |
||||
|
Salinity (i.e. SSS: average at 10m, estimated as the interpolated mean value for the whole area)) |
|||||||
|
Community |
Fish Community condition |
Community |
Total pelagic fish NASC |
||||
|
Species composition (i.e. percentage in terms of weight of pelagic trawls per hour)* |
|||||||
|
Age and size distribution |
95% percentile of the population length distribution for the target species |
||||||
|
Proportion of fish larger than L50 (length at first maturity estimated based on collected data or defined based on literature) |
|||||||
Tables for DCF Data Call
The common templates (e.g. https://dcf.ec.europa.eu/data-calls/medbs_en), currently used for submission of MEDIAS results to Data Calls by MS, provided by JRC, are the following:
|
Abundance (in numbers per species per sex and length class) |
|
|
Biomass (biomass per species per sex and length class) |
|
|
Abundance biomass (abundance and biomass per species per sex and age class) |
Common format for presentations at MEDIAS Coordination Meetings
• GSA number and general information on the GSA; map and general information on the acoustic survey
• Type of echosounder and frequencies in use
• Calibration results
• Survey design
• Number of nautical miles effectively processed for biomass estimation
• Biomass estimation results in tons by GSA and graphs in terms of biomass density (time series of average t/nm2)
• Headline, footrope length of the pelagic net, sidelines dimensions, mesh size
• CTD stations map
• Biomass per length classes (0.5 cm) and per age classes in tons
• Graphs of Age Length Keys (in %, with total No. otoliths, by length classes)
• Maps of anchovy and sardine spatial distribution (proportional maps of NASC values - bubble plots)
• Map with pie charts reporting % in weight of anchovy, sardine and other species.
Other results of interest from acoustic surveys could be also reported but they are not mandatory.
Data accessibility
As the MEDIAS Steering Committee acknowledges the need for MEDIAS data and output accessibility it was agreed to:
1) MEDIAS data need to be available after March 31 of the next year (e.g. N+1 March 31, where N is year of the survey), and MS and end-users are recommended to respect this date (Recommendation No. 12 from RCM Med&BS meeting in 2016);
2) MEDIAS results per survey are presented in the Annual MEDIAS report which is freely available in the MEDIAS website;
3) Overall biomass and abundance estimates are available through the DCF Data Call;
4) Include annual distribution maps of NASC per species along with the respective metadata information in a GEOportal.
Detailed data per EDSU could be available to third parties through the GEOportal. The third party should send a request and present to the Steering Committee the type of data requested, the purpose for which data are needed and exchange ideas for collaboration.
References
Anonymous 2012. “AcousMed: Harmonization of the Acoustic Data in the Mediterranean 2002- 2006”. Final Report. MARE/2009/09, 212 pp.
Bonanno, A., Barra, M., De Felice, A., Giannoulaki, M., Iglesias, M., Leonori, I., Ventero, A., Aronica, S., Biagiotti, I., Tičina, V., Canduci, G., & Genovese, S. (2021). Acoustic correction factor estimate for compensating vertical diel migration of small pelagics. Mediterranean Marine Science, 22(4), 784–799. https://doi.org/10.12681/mms.25120
Demer, D.A., Berger, L., Bernasconi, M., Bethke, E., Boswell, K., Chu, D., Domokos, R., et al. 2015. Calibration of acoustic instruments. ICES Cooperative Research Report No. 326. 133 pp.
Giannoulaki, M., Zwolinski, J., Cemal Gucu, A., De Felice, A., & Somarakis, S. (2021). The “MEDiterranean International Acoustic Survey”: An introduction. Mediterranean Marine Science, 22(4), 747–750. https://doi.org/10.12681/mms.29068
ICES, 2017. Report of the Workshop on Age estimation of European anchovy (Engraulis encrasicolus). WKARA2 2016 Report 28 November - 2 December 2016. Pasaia, Spain. ICES CM 2016/SSGIEOM:17. 223 pp.
ICES, 2008. Report of the Workshop on Small Pelagics (Sardina pilchardus, Engraulis encrasicolus) maturity stages (WKSPMAT), 10–14 November 2008, Mazara del Vallo, Italy. ICES CM 2008/ACOM:40, 82 pp.
Leonori, I., Tičina, V., Giannoulaki, M., Hattab, T., Iglesias, M., Bonanno, A., Costantini, I., Canduci, G., Machias, A., Ventero, A., Somarakis, S., Tsagarakis, K., Bogner, D., Barra, M., Basilone, G., Genovese, S., Juretić, T., Gašparević, D., & De Felice, A. (2021). History of hydroacoustic surveys of small pelagic fish species in the European Mediterranean Sea. Mediterranean Marine Science, 22(4), 751–768. https://doi.org/10.12681/mms.26001
Machias A., Pyrounaki M.M., Leonori I., Basilone G., Iglesias M., De Felice A., Bonanno A., Giannoulaki M. 2013. Catch of pelagic hauls in Mediterranean acoustic surveys: Is it the same between day and night? Scientia Marina, 77(1): 69-79. http://dx.doi.org/10.3989/scimar.03656.21D
Walline, P.D. 2007. Geostatistical simulations of eastern Bering Sea walleye pollock spatial distributions, to estimate sampling precision. ICES Journal of Marine Science, 64: 559–569.
Summary table of the common protocol for the MEDiterranean International Acoustic Survey (MEDIAS).
|
Survey Identity |
|
|
Geographic area |
Should be reported |
|
GSA area |
Should be reported |
|
Size of Area to be covered (NM2 / km2) |
Should be reported |
|
Days at sea |
Should be reported |
|
Vessel |
Should be reported |
|
Vessel length |
Should be reported |
|
Vessel HP |
Should be reported |
|
Period of survey |
Should be reported |
|
Echo sounder parameters |
|
|
Echo sounder |
Split beam |
|
Frequency for assessment (kHz) |
38 |
|
Complementary frequencies (kHz) |
18, 70, 120, 200, 333 kHz depending on availability. |
|
Pulse duration (ms) |
0.5 or 1 ms, should be reported |
|
Beam Angles (degrees) |
Should be reported |
|
Athw. Beam Angle, Alog. Beam Angle |
|
|
Ping rate |
Maximum depending on depth |
|
Calibration (No per survey) |
A calibration report should be given |
|
Threshold for acquisition (dB) |
-80 |
|
Threshold for assessment (dB) |
-70 to -60 (reported) |
|
Survey design |
|
|
Transects design |
Perpendicular to the coastline/bathymetry, otherwise depending on topography |
|
The survey design according to the MEDIAS conclusion for each area and should be reported. |
|
|
Inter-transect distance (NM) |
Max <=12 NM. The inter-transect distance should be according to the MEDIAS conclusion for each area and |
|
should be reported |
|
|
Time of day for acoustic sampling |
Day time. |
|
Otherwise, in cases of time limitation and if echo allocation into species does not depend on school shape identification (in this case justification of the accuracy of results will be presented) |
|
|
EDSU (nm) |
1 NM |
|
Distance from the coast according to the Bottom depth (min, m) |
Bottom depth should whenever this is possible reach the 10 m isobath |
|
Echo sounding depth (min, m) |
Depending on the draught of RV. Should be reported |
|
Echo sounding depth (max, m) recording. |
200 m |
|
Vessel speed |
8-10 knots |
|
Software for analysis |
Movies and/or Echoview |
|
File format |
*.hac |
|
Inter - transect |
Acoustic energy in the inter-transect track will not be taken into account |
|
Applied TS (dB) |
Sardine: -72.6 dB, See also handbook |
|
Other species: Keep historical TS equations. |
|
|
Echo partitioning into species |
Echo trace classification based on echogram visual scrutinisation |
|
Direct allocation and allocation on account of representative fishing station |
|
|
Abundance estimates |
|
|
Abundance indices estimated |
Total fish NASC per EDSU |
|
Anchovy, Sardine NASC per EDSU |
|
|
Anchovy, Sardine Biomass per EDSU |
|
|
Anchovy, Sardine Numbers per EDSU |
|
|
Anchovy, Sardine Number/age and per length class |
|
|
Anchovy, Sardine Biomass/age and per length class |
|
|
Maps and charts |
Point maps of total fish NASC |
|
Point maps of target species in NASC/mile; biomass / mile. |
|
|
Catch compositions of the hauls, pies charts indicating biomass per species |
|
|
Fish sampling |
|
|
Target species |
Anchovy, Sardine |
|
|
Biological data for all species in the pelagic community: |
|
Other species |
Length-Weight relationships; Length distribution. |
|
Fishing gear, codend mesh size |
Pelagic trawl, Codend and trawl characteristics should be reported. Max Codend mesh size = 24 mm (side of mesh = 12 mm). |
|
Vertical opening of the pelagic trawl |
Should be reported |
|
Netsounder used |
Should be reported |
|
Duration of haul |
Minimum 30 min for unknown echoes |
|
Time of sampling |
Both daytime and night time biological samples from the same survey will be used. |
|
Vessel speed during fishing |
3.5 – 4.5 knots |
|
Sampling intensity, no of hauls |
The total number of hauls has to be adequate to: |
|
ensure identification of echo traces; |
|
|
obtain length structure of the population; |
|
|
obtain species composition; |
|
|
get biological samples. |
|
|
Biological and oceanographic parameters |
|
|
Length |
All species: Total length (TL), Length frequency distribution |
|
(0.5 cm) |
|
|
Age readings, ALK |
Sardine, Anchovy: Mean TL at age |
|
Sample sizes according to the new DCF. |
|
|
Length - Weight |
All pelagic species |
|
Oceanographic. Parameter (CTD) |
Minimum 3 CTD per transect or grid of stations with density adequate to describe the oceanography of the surveyed area. |
|
Minimum variables: T, S |